Oh you, young and motivated SaaS company. I know you very well. You have a disruptive way of seeing things, a cool product, reasonable prices (well…), and just want to make the world a better place. But you won’t be able to do that if you don’t try to understand the behavior of your hard-earned customers.
You know (well informed that you are) that the “Leaky Bucket theory” is a real thing. Acquiring a new customer will cost you more than trying to keep the ones you already have. And that’s where Kissmetrics in-app analytics and machine learning can help you make better-informed decisions for your customer retention campaigns.
If you’re reading this, I must assume that you already have a fairly good idea of how Kissmetrics works, but, you may have encountered some problems when trying to set machine learning on top of it, and get precise answers. And that’s what we are going to be talking about today: “For machine learning to answer my burning questions and help me reduce customer churn, what should I track in Kissmetrics?”
The good news is that it is easy to get your Kissmetrics tracking plan well suited for machine learning (in case you weren’t following earlier, customer retention goes hand in hand now with predictive analytics and thus, machine learning). With just a few tweaks to your Events, Funnels and Marketing Campaigns, you’ll be getting the exact answers you’re looking for to keep your customers happy and drive growth.
So…follow the lead!
What you need to do first: Prepare your dataset
First thing’s first, you need to know that Kissmetrics lets you export your data. If you think you can manage this on your own (for this part of the process), then just skip this part and jump straight to: “Enter the fray: Define your targets and events”.
For all the others that stayed with us, let’s press on. So, Kissmetrics has a Data Export feature that’s easy to set up. If you’re already lost, check this link and then come back to this section. Interesting enough, your data even goes to S3 on Amazon.
Anyways! After exporting your data, you will get files with JSON lines. Amongst these lines, some are events, some are properties settings, some are aliases…etc. There is definitely some data preparation work to be done here. In particular, you need to reconstruct aliases history, and gather your users’ properties.
It might not seem very user friendly at first, but this export format has a crucial advantage for machine learning. Indeed, most analytics apps map user properties for a single day. But machine learning needs to access user data over a large period of time. The longer the available period, the more accurate the predictions on the user’s behavior will be. And this is just what I love about Kissmetrics compared to other analytics: you can reconstruct the properties state of every user at any point of time!
Once you’ve built nice data tables, you need to define how far you will look into the past, how far you will look into the future (who will churn in the next 7, 14 or 30 days?), and you need to gather your targets (aka the answers to the above questions). Only then will you be ready to use machine learning. So, without further ado, let’s move on to defining your targets and events.
Enter the fray: Define your targets and events
Machine learning is good at answering binary questions: “Will my user convert or not”, “Remain active or not”, “Upgrade or not?”, etc. Ask the machine and it outputs a ‘score’ for every single customer. A score is a probability for the answer to be “yes”. The higher the score, the more likely your user is to behave like the target (got it ? :P).
Step 1: List out what you need to predict
The first rule to uphold is: track anything that describes the target’s behavior, i.e. what you want to predict. To predict conversion, you need to define a conversion event, and to predict churn, you need an unsubscription event. Make sure these events are included in your tracking plan.
For all ‘retention’ type questions, you’ll need to choose a global activity metric based on your events. Classically, you can use stickiness, number of events, engagement indices or power usage.
If you choose stickiness, you ideally want to track daily visits to your app. “Log-in” events are tricky since a user can be logged in for several days without logging out. So instead, some companies track massive events with very little information, like “Page View”. But “Page View” is expensive for most tracking plans and too general to help. My advice is always to spend your money on valuable events, such as your key features and funnels! You’ll miss the few visits where users did not trigger any of your interesting features, BUT you will focus the machine on what really matters in your app.
That being said, be careful not to fall into the trap of overly specifying events that are too rare to build reliable statistics on, or too numerous to be understood by a human – or sometimes even by the machine.
Step 2: List your app’s key features
Machine learning is not magic and it’s not a palm reader either (even if we want it to be just that). It predicts the future by analyzing the past, and looking at usage patterns which drove certain behaviors or targets (e.g. conversions, upgrades, etc…). Then, based on recent behavior, it computes the chances of observing the target in the future. The word “behavior” is important. The machine reads behavior in your events, and the success of your predictions clings to your tracking plan and its precision.
Obviously, business outcomes such as conversion, upgrades, or churn will depend on how users interact with your app. List the key features in your app and make sure that each of them is properly tracked with one specific event.
For better readability, I strongly suggest naming events by clearly referring to their respective app features. For instance, don’t name a click event by its button shape (e.g. “right corner red button”) but rather by its functionality (e.g. “delete project”). This way the machine could output “Users which delete projects more than15 times in the last 3 days are 2 times more likely to churn”. Good naming will also help you in your daily usage of Kissmetrics.
But don’t be too hasty when creating your tracking plan! Not all events are valuable. It seems reasonable to say that “You know that an event is valuable when, by removing it, you lose global value”. Losing value in machine learning means degrading the predictions. So a valuable event is an event that drives predictive power. Yep! Sometimes, more is actually less. ;)
So in short:
- Track anything that describes what you want to predict
- Track all the key features of your app
- Don’t use too generic events
- And don’t be overly specific in your events’ definition
If you want more information about event tracking, Diana Smith from Segment gave a great presentation a few weeks ago. You can find it here.
All of this constitutes your tracking plan, so you can now move on defining your funnels.
Step 3: Define behavioral funnels
I am sure you have defined marketing funnels in Kissmetrics, such as a signup conversion funnel “Viewed HomePage -> Viewed Sign Up Page -> Completed Sign Up”. Marketing funnels are key to monitoring your main business KPIs.
From a product perspective, behavioral funnels are valuable to measure task/feature completion in your application, e.g. Added Member -> Created Task -> Assigned Task in a project management app. Analyzing these funnels helps you point out, on your user paths, actions driving engagement and those causing frustration (eventually churn).

Behavioral funnels will require you to track more events, and can turn out to be expensive. However, I recommend that you keep them in place as long as they are notably improving your predictions.
Step 4, AKA The end of the road: Make your tracking stable
As stated before, machine learning builds models based on past events and looks at present events to predict future events. Changes in your event tracking plan may harm your predictions. Therefore, it’s very important to carefully plan the redefinition of each event. Ideally, events should only be changed when major versions of your service are released. I would recommend to:
- Introduce versions of the same event “feature1_v1″, “feature1_v2″…
- Spot the events that are bounded to be unstable and suffix them with “_noML”. Thus ignoring them in the machine
- Ignore the adding, removing or renaming of an event (new or old feature) for some time, or ignore it retroactively
- Lower the level of detail of your targets in unstable times, e.g. “Pay Event” instead of “Pays $19 Event” will make transitions smoother between Pricing Plans.
After all these magnificent tips, you’re ready to use Machine learning. There are Open Source Libraries (Scikit-learn, Shogun, Mahout, Spark MLlib…), and Predictive APIs (PredicSis API*, Google Prediction API, prediction.io…) here to help you out. Several SaaS companies have recently appeared to offer an end-to-end service, from Data Export to Scores (ChurnSpotter.io*, Preact.com, Frontleaf.com…). Keep an eye out for them; some of them already support Kissmetrics.
Enjoy the fruits of your labor: Track your campaigns
Finally after this long journey of events and tracking, you hold your scores in hand, AKA the answers to questions like “Who will stop using my app tomorrow and why?”, or “How many return customers can I expect?”. One score per user depending, of course, on the chosen target.
Anyway, now is the time to take action on your scores and to convince the hesitating users to become great customers.
First, push the scores to Kissmetrics as user properties so that you can segment users by scores. My advice is to round scores in order to get 10 segments “0-0.1″, “0.1-0.2″, …,”0.9-1″.
Suppose you need to increase your expansion sales, and you’re sending emails for an upgrade campaign. You will use the “upgrade” scores, which reflect the propensity of each of your users to upgrade. In Kissmetrics, track your campaign and build your campaign report by segmenting by scores, and filtering on people to whom you send the email. Build a control report, also segmented by scores, this time, filtering on users who did not get the email.
You will probably notice that very high scores upgrade anyway (“loyal” users), and very low scores do not upgrade whether they were sent the email or not (“lost” users). However, your campaign was effective on middle scores (“undecided” users), and you learned (wait for it…) who are the “undecided-but took-the-right-decision” users who compose your target for this particular campaign.
![]()
The next time you send emails, you can differentiate your message based on scores, or adapt to the likelihood of your user to upgrade. This allows for a better communication with each user, the detection of dissatisfied users early enough, and the reduction of the marketing pressure thanks to optimized targeting. That is how machine learning will boost your upgrades hence your expansion MRR!
Conclusion
As the saying goes: “A picture is worth a thousand words”, so, without further ado, here is a little picture summarizing the idea behind this article.
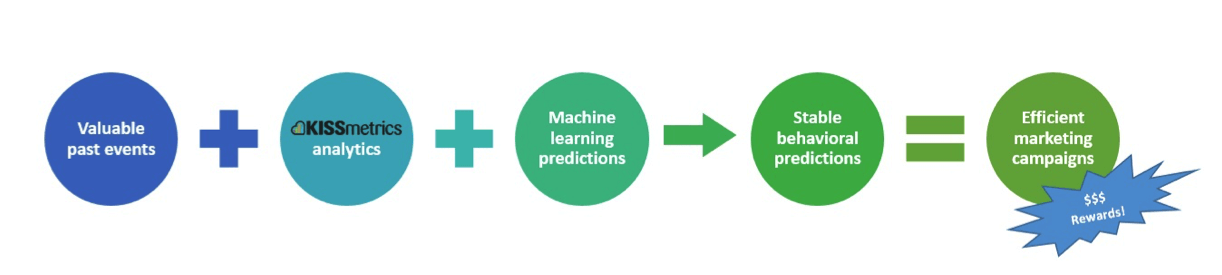
Machine learning has never been so accessible to non-machine learners; and could bring significant benefits to your business once fed by analytics. You’ve already gotten off on the right foot by using Kissmetrics, now get the machine to help you anticipate customers’ behavior, and move to data-driven predictive marketing!
* Full disclosure, I work for PredicSis as a machine learner, and participated in the birth of our ChurnSpotter product, which do all the hard work for you and enable you to better retain your users.
About the Author: Florence Bénézit currently works at PredicSis on the ChurnSpotter.io project. She holds a Ph.D. from EPFL, Switzerland, in Distributed Signal Processing. She has been working as a Data Scientist in the industry for the last 4 years.
No comments:
Post a Comment