Every second there are 20,000 people on Facebook. That number alone makes it a valuable website for marketers, whether you’re promoting a service, releasing a product or conducting market research.
What began as a way for college students to connect has grown into one of the world’s largest social networks, and one of its greatest marketing resources, too. But in order to be successful on Facebook, you have to dig below the surface and familiarize yourself with the ins and outs of the platform.
Here are some important Facebook statistics—broken down by users, Pages, ads, geography and industry—to help guide your social media strategy.
Facebook User Stats
Before we dive into the really interesting Facebook stats, here are some important numbers you should be aware of. As of Q1 2015, Facebook has:
- 1.44 billion monthly active users
- 1.25 billion mobile users
- 936 million daily active users
- 798 million mobile daily active users
To put things in perspective, Facebook now has more active users than China’s entire population (estimated to be 1.40 billion).
For a more in-depth breakdown of Facebook user demographics—including age, gender, income and education—see our previous article, Social Media Demographics for Marketers.
In addition to those, here are a few other stats to keep in mind when creating your Facebook strategy.
The Average American Spends 40 Minutes Per Day on Facebook.
When you consider how much time Americans spend engaging with digital media–nine hours a day—40 minutes on Facebook might not seem like a lot of time. But let’s compare that to the amount of time spent on other social platforms.
- Tumblr—34 minutes
- Instagram—21 minutes
- Pinterest—20.8 minutes
- Twitter—17 minutes
- Snapchat—17 minutes
- Ello—13 minutes
- LinkedIn—9.8 minutes
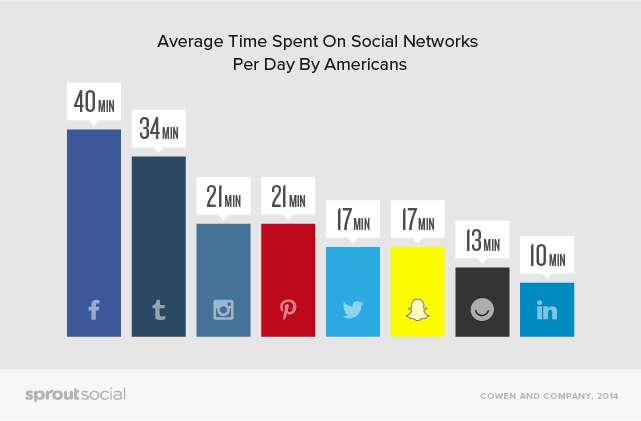
In terms of capturing your target audience’s attention, Facebook presents a great opportunity since you have a larger window of time to work within. That said, people share 1.3 million pieces of content on Facebook every minute of every day so yours had better stand out. Make sure you’re up to date on the latest tips and tricks to help reach your audience.
Younger Facebook Users Have Significantly Larger Networks Than Older Users
According to data from Pew Research, 27% of adults 18-29 years old have more than 500 friends in their network, while only 15% of 30-49 year olds do.
An individual’s network can be just as valuable to your business as the individual. Networks are created around similar interests, and word-of-mouth referrals are valued more than ever before. If someone is talking about your brand or interacting with your Facebook Page, that activity will be displayed to their connections, effectively extending your reach.
24% of Non-Adopters Use Someone Else’s Facebook Account
Something else to consider: you’re not always reaching the person you think you are. Slightly more than half of people without Facebook live with someone who has an account. This is important because 24% of those non-adopters look at photos or updates on that person’s account.
With the unpredictability of the News Feed, it’s hard to say whether the creator of that account will see your post once the non-adopter scrolls past without engaging. For this reason, and many others, use Facebook’s feature set to your advantage instead of relying on a single status to get your message across.
Facebook Mobile Stats
Although Facebook lacked a strong mobile component as little as two years ago there are now, on average, 486,183 people accessing the social network from their mobile device every minute. As you build and refine your Facebook marketing strategy, be sure to keep these mobile users in mind.
75% of Facebook Video Views Occur on Mobile Devices
Consumers are watching and uploading videos to Facebook more than ever before. According to Mark Zuckerberg, the social network’s users view more than four billion videos a day—that’s up from just one billion in September 2014. Sheryl Sandberg went on to say that now 75% of those video views occur on mobile devices.
As a business, you must be sure that your company’s assets are mobile friendly. Some of those viewers will visit your website or product page after watching your video, and they’ll do so from their mobile device. It could have a major impact on your sales if your site doesn’t display or function properly.
Two-thirds of smartphone users said that a mobile-friendly site made them more likely to buy a company’s product or service, according to a survey conducted by market research firms Sterling Research and SmithGeiger. Half of respondents went on to say that even if they like a business, they’ll use its site less often if it doesn’t work well on their smartphone.
581 Million Facebook Members Are ‘Mobile Only’
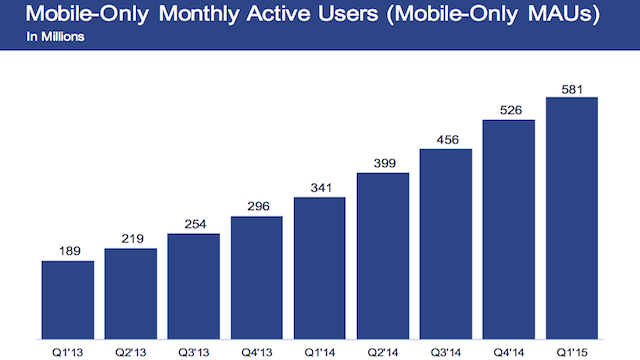
Of the 1.44 billion people who use Facebook each month, 581 million only log in using their mobile devices. That means whether they’re commenting on a Page post or watching a video, they’re only doing so from mobile. If your call-to-action works and they go on to read more about your company’s backstory or make a purchase, then that process had better be compatible with their device.
It also means that advertisers can have even more precise targeting for Facebook’s Mobile App Ads. With targeting around specific devices and operating systems, you can now deliver ads to people specifically using an iPhone 5S with a minimum OS version of 7.0 who are on Wi-Fi, for example.
Facebook Page Stats
Your Facebook Page is the heart of your presence on the social network. How you approach it can mean the difference between an engaged community of fans or an audience of one, which unfortunately would be you. In 2014, Facebook revealed that there are 40 million active small business Pages. Don’t let your message fall on deaf ears; use these stats to rise above the noise.
49% of Consumers Like a Facebook Page to Support the Brand
When it comes to crafting content for your Facebook Page, it’s helpful to know why people are there in the first place. If you can understand what it is they’re hoping to get out of a Like, then you can deliver the most relevant and appealing content in order strengthen your relationship with those individuals.
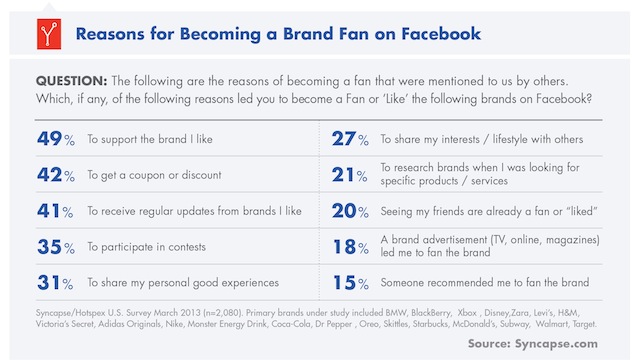
According to a 2013 study from Syncapse, the most popular reason why people Like a Facebook Page is to support the brand. This is notable because it means that some people are willing to align themselves with businesses and endorse their products without any kind of financial incentive. These are the people you want to identify when looking for brand ambassadors.
40% of Consumers Don’t Like Brands At All
Being active on Facebook and engaging with branded content aren’t mutually exclusive, however. In this 2014 study, Kentico asked people how many brands they Like on the social network. Here are their responses:
- 39% said 1-10 Pages
- 7% said 11-20 Pages
- 6% said 21-30 Pages
- 40% said they don’t Like Pages at all
Trying to reach the 40% of people who don’t Like Pages is challenging, but not impossible. Your Page posts won’t reach them, but your Facebook Ads might.
The 1-10 group appears to be more selective in which Pages they align themselves with. This is an audience that you want to connect with. Not only do they put thought into which brands they engage with, but they probably favor loyalty over one-time-only interactions.
Video Posts Average 62% More Engagement Than Photos
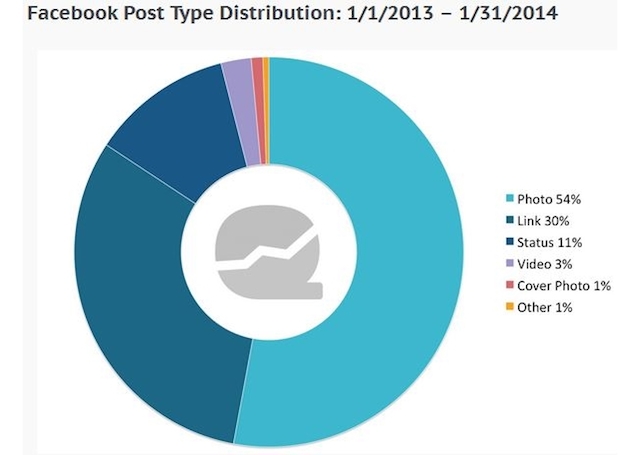
Research by Quintly found that photos were the most common type of content posted by Facebook Pages, accounting for 54% of posts worldwide. But while photos continue to generate strong engagement, videos return significantly higher numbers.
The company analyzed 72,194 Facebook Pages over the course of a month and found that videos averaged 2,183 interactions, compared with 1,358 for photos—that’s a 62% increase. At the time of the study, videos only accounted for a 3% share of the total content amount.
While that percent has likely grown with time, and there’s more video to compete with today than a year ago, a well-crafted piece of content can go a long way. Experiment with different themes and lengths of time to find the sweet spot for your audience.
Posting 1-2 Times Per Day Yields More Engagement
It might seem counterintuitive, but posting less frequently can actually help your engagement. Not surprisingly, it’s quality not quantity that helps you get ahead on Facebook. Research shows that brands that post just once or twice a day get 73% more comments and 32% more Likes than those who post three or more times.
This can help you to be more strategic with your content strategy. Rather than posting for the sake of populating your Timeline, plan your updates around milestones, product launches or initiatives from other departments (such as sales, human resources or customer support).
Facebook Advertising Stats
One thing that has definitely been on the rise recently is the importance of ad managers. Facebook is first and foremost a social network, but marketing and advertising are becoming much more intertwined than ever before. Now it’s not enough to do just one or the other; your campaigns have to seamlessly blend together for maximized effect.
Facebook Ad Prices Have Increased By 247%
Due to higher quality, Facebook reported during its Q3 2014 earnings call that price per Facebook Ad has increased 247%. Businesses, especially the 40 million small businesses using the platform, need to have a much better understanding of who their target audience is in order to generate a better return on investment from their ads. It’s no longer cost effective to throw together an ad and cast it out using the widest net. You really have to dive into your audience segments and tailor your ads to best meet their interests.
The Overall Click-through Rate Lift From Using a Call-to-Action Button Is 2.85x
Great for business objectives, call-to-action (CTA) buttons help your audience clearly understand the action you want them to take after viewing your Facebook Ad. Currently you’re able to choose from the following:
- Shop Now
- Book Now
- Learn More
- Sign Up
- Download
After a one-month review of AdRoll advertisers’ running Facebook campaigns with CTA buttons, the company found that those ads experienced a 2.85x higher click-through rate compared to ads that didn’t have a CTA.
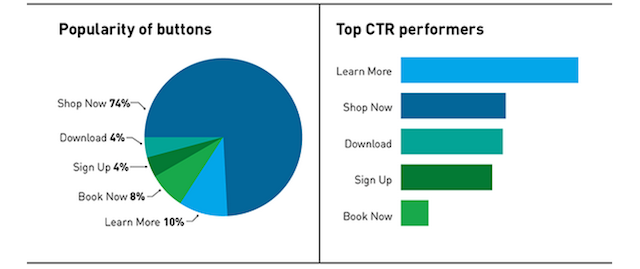
As you can see, 74% of advertisers preferred the “Shop Now” button, while only 10% preferred “Learn More,” which outshined the former in terms of performance.
Adding a CTA to your News Feed ad doesn’t cost extra, so be sure to consider the option when creating your next ad.
Click-through Rates Are Higher for Custom Audiences Than Facebook Exchange
According to research from Kinetic Social, click-through rates for Website Custom Audiences (WCA) were outperforming those on Facebook Exchange (FBX). In December 2014, the average CTR for U.S. retargeted display ads run on WCA was 1.25% compared to 0.12% on FBX.
It’s worth noting that this isn’t exactly a fair comparison; FBX ads are desktop-only while WCA placements support desktop and mobile. That said, eMarketer expects mobile to account for 61.5% of time spent on Facebook per day by U.S. adults this year, so choosing an option that supports mobile is in your best interest.
Facebook Drives Almost 25% of All Social Referral Traffic
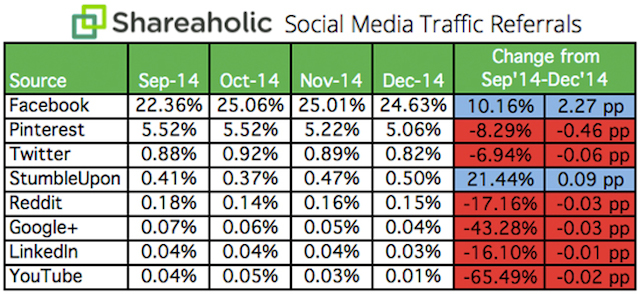
Facebook is the clear leader in social referral traffic, driving almost 25% of all referral traffic. The social network’s total share of visits to Shareaholic’s network was 24.64% in December 2014, far above Pinterest which came in second place at 5.06%. In fact, according to Shareaholic’s data, Facebook drives more referral traffic than Pinterest, Twitter, StumbleUpon, Reddit, Google+, LinkedIn and YouTube combined.
Of course, not all of these referrals are paid—it’s likely a mix of organic and paid with views coming from both Pages and Facebook Ads. When you consider the audience size of these Pages, this metric really speaks to their ability to target highly relevant content to people who are the most interested in it. If everyone could tap into that segmentation power, we imagine that this stat would be much higher.
Facebook Geo Stats
Aside from its size, what makes Facebook so attractive to marketers is its reach—you can deliver messages to the neighbors down the street from your shop, or across the ocean.
More Than 70 Translations Are Available
In order to support its global audience, Facebook has more than 70 languages available thanks to a framework that lets community members translate text on the platform. At this time, more than 300,000 people have contributed translations for different languages and dialects.
Global brands need to take this into consideration. Use analytics to help you understand the demographics of your audience, and keep an eye out for where large fan bases live. From there you can target your Page posts by location or language.
For example, if you limit the language of your post’s audience to Spanish, only people who have Spanish set as their language on Facebook or list Spanish as one of their languages on their profile will be able to see your post on your Page as well as in News Feed and search.
The U.S. and Canada Are Only a Small Subset of Facebook’s Global Reach
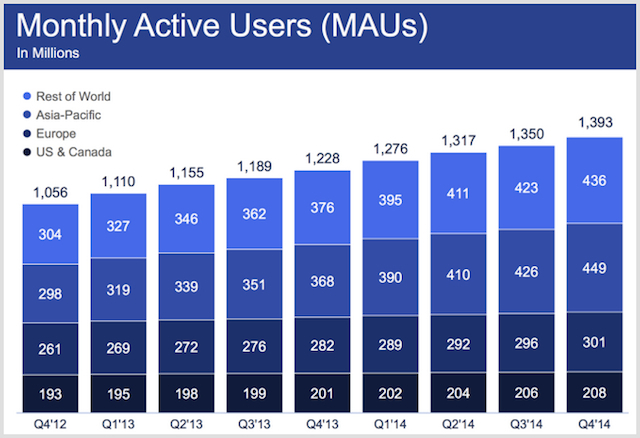
Facebook’s 1.44 billion users are spread around the world. Of those, only 208 million monthly active users are located within North America—according to data from Q4 2014. Europe has another 301 million, while Asia Pacific tops the bill with 449 million. The rest of the world accounts for approximately 436 million.
Facebook itself has revealed that 82.8% of its daily active users are outside of the U.S. and Canada. This just reconfirms that global brands need to think more strategically about their content—a one-size-fits-all kind of approach won’t be successful. If you have an international presence, your social media managers need to be well versed in a range of languages, dialects, time differences and cultures.
Facebook Industry Stats
Another appealing feature of Facebook is its diversity among businesses. Not only can you reach a remarkably varied group of people, but businesses across industries can participate. From the glitz and glamour of the entertainment industry to hyper-focused utilities, there’s something here for everyone.
Media and Entertainment Brands Receive the Most Engagement
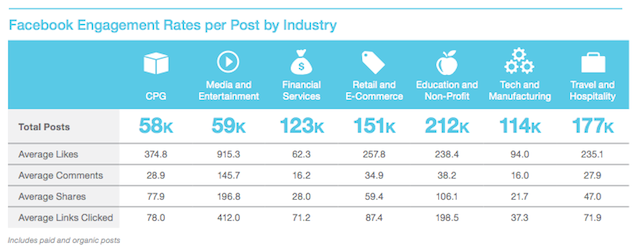
Salesforce tracked more than 2.4 million Facebook posts and found that the media and entertainment industry posts received the most Likes, comments, shares and links clicked. On average, this industry received:
- 915.3 Likes
- 145.7 comments
- 196.8 shares
- 412.0 links clicked
While it could be difficult to recreate those numbers—in terms of comments, the second-place industry didn’t even come close—it’s a good reminder to share the kind of content that your audience wants. Pay close attention to the information provided by Insights to see what post types your fans are engaging with the most, and tailor your content appropriately moving forward.
Engagement is 29% Higher on Sundays For the Finance Industry
One of the greatest challenges is determining the best time to publish content on any social network. While there’s no surefire formula, a 2013 infographic fromLinchpinSEO could shed some light on the conundrum.
According to the infographic, the best day for financial brands to post to Facebook is Sunday. This might seem counterintuitive since most banks aren’t open on Sundays, but that doesn’t mean your customers aren’t online. If your social media manager isn’t available, rely on a social media management tool to schedule your posts.
Most of the industries included in the infographic saw high engagement rates on weekends. The technology industry, however, is one of the few that received higher engagement during the week. In fact, for technology brands, engagement is 30% higher than average on Mondays. Don’t let a case of the Mondays stop you from interacting with your customers.
There’s a lot more to discover about Facebook and all of its tools, but these stats are a great starting point. And don’t forget that you can conduct some of your own research by keeping an eye on Facebook Insights or requesting your own Facebook Report through Sprout Social.
The post 17 Powerful Facebook Stats for Marketers and Advertisers appeared first on Sprout Social.
Somewhere the content of the blog surrounded by little arguments. Yes it is healthy for readers. They can include this kind of language in their writing skill as well as while group discussion in college.โฆษณา ผ่าน facebook
ReplyDelete